The Summary page will provide you with a convenient overview of your survey results – from average scores per survey construct/topic, and top/bottom scoring survey questions, to a heatmap of the survey scores of the top-level business units, the survey scores per demographic category, and the survey participation rates. The content has been structured such that it can be used as the basis for survey-related feedback – whether in real-time by means of the analytics dashboard, or via PDF files that can be generated with the click of a button.

Calculating Survey Scores & Sampling Errors
The survey scores of all multiple choice (Likert) and dropdown survey questions are shown as a score out of 10, regardless of how many Likert options the survey questions had – see Calculating Survey Scores for a more detailed explanation. As an indication of whether the number of survey responses are sufficiently representative of the group being surveyed, a context sensitive sampling error icon will also be displayed where appropriate – Sampling Size & Errors for a more detailed explanation.
Selecting & Filtering Survey Results
The survey results on this page will be displayed according to the (1) survey model and campaign as selected in the Datasets toolbox in the side panel (see Survey Models/Datasets for more), and the (2) current active filter that has been set for business units, demographics and/or engagement level (see Filtering Survey Responses for more).
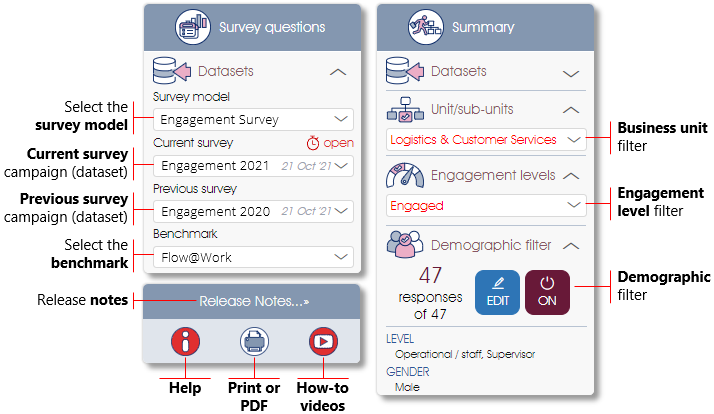
Click on the Print/PDF icon to print or generate a PDF report of the current content as displayed, and on the How-to icon to view video of the analytics dashboard.
Engaged@Way-of-Work & Inclusion@Way-of-Work Survey Results
Surveys that are substantially based on the Engaged@Way-of-Work engagement or Inclusion@Way-of-Work diversity and inclusion surveys, or which at least included the Willingness and Commitment indicator and/or Diversity and Inclusion constructs, will have separate Indicator sections where the engagement levels and inclusion indicator scores are summarized (see Indicator Analytics for more).
Summary of Engagement & Inclusion Indicator Scores
Summarizes the engagement and inclusion indicator scores (state or levels of engagement or inclusion), i.e. how engaged or inclusive the organization or business unit(s) are, as well as the Organizational Wellbeing & Resilience score (if included in the survey).
|
|
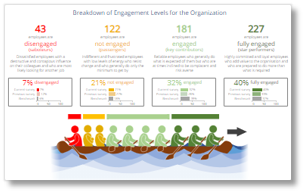
Engaged@Way-of-Work: Distribution of Engagement Indicator Levels
The first panel summarizes the engagement levels at organizational or business unit level (depending on the business unit filter), including a breakdown of the number of respondents per engagement level, and comparisons to previous surveys and the benchmark (where applicable).
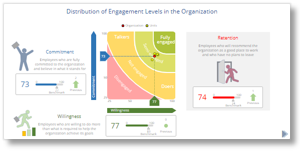
The 2nd panel includes a scatter graph that graphically maps the engagement levels of the organization and business units by means of the Willingness and Commitment indicator scores, with either Retention, Wellbeing or Inclusivity shown separately.
- See Engaged@Way-of-Work Survey Model for more on how engagement levels are measured and calculated.
- Click on the arrow at the bottom/right of the panel to navigate to the Indicator construct section of the Survey Questions page.
|
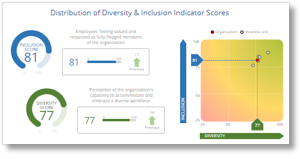 |
Inclusion@Way-of-Work: Distribution of Inclusion Indicator Scores
Scatter graph that graphically maps the diversity and inclusion scores of the organization and business units by means of the Diversity and Inclusion indicator constructs.
- Click on the arrow at the bottom/right of the panel to navigate to the Indicator construct section of the Survey Questions page.
- See Inclusion@Way-of-Work Survey Model for more on the survey model.
|
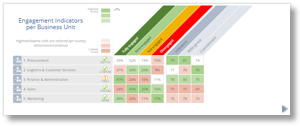 |
Heatmap of Indicator Scores per Business Unit
Comparative heatmap that shows the engagement indicator scores (Willingness and Commitment) or inclusion indicator scores (Diversity and Inclusion) per high-level business unit, as well as the Wellbeing or Inclusivity scores where appropriate.
- Click on the arrow at the bottom/right of the panel to navigate to the Heatmap page for more detail.
- Click on the arrows next to the business unit names (where shown) to expand the business unit.
- See Comparative Heatmaps for more on how to expand the business units or set a survey question or demographic filter for the heatmap.
|
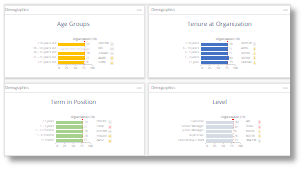 |
Indicator Scores per Demographic
The survey scores of Indicator survey questions will be summarized via bar graphs for each of the demographic categories (e.g. Gender, Age Group) as defined in the Manage PARTICIPANTS module. Each demographic category’s scores will be calculated and displayed per demographic attribute (e.g. Male, Female in the case of the Gender category).
- See Edit Demographic Data for more regarding the use of demographics in surveys.
- Survey scores of demographic attributes with insufficient responses (fewer than the anonymity threshold) will not be displayed (see Sampling Size & Errors for more on this).
|
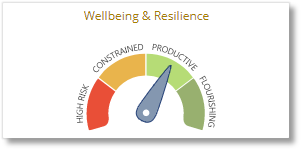 |
Organizational Wellbeing & Resilience Scores
Indicator dial that shows how well the respondents are coping and how productive they are despite the new way of work. The dial will only be displayed if the Wellbeing & Resilience indicator construct has been included in the Engaged@Way-of-Work engagement survey.
Scroll down to the Heatmap panel to see the scores for the Wellbeing & Resilience indicator.
The state of organizational wellbeing is measured with a number of carefully selected survey questions, and is shown in the analytics dashboard as an Index score (out of 100). The Index dial uses the average scores for the Index survey questions, with thresholds as follows:
- Flourishing (score >85): your employees have adapted well and are flourishing in their transition to the new way of working — now is a great time to plan for maintaining this flourishing in an uncertain future.
- Productive (score 70 - 85): your employees are transitioning well into their new way of working – there are still a few issues to address to help ensure they maintain high levels of performance during this period.
- Constrained (score 55 - 70): your employees are facing some challenges adjusting to the new way of working – consider ways of providing them with more support and direction to ease their transition.
- High Risk (score < 55): your employees are having a hard time adjusting to the new way of working — they urgently need more support, communication, and direction at this time to be effective.
|
Engagement or Inclusion Driver Scores
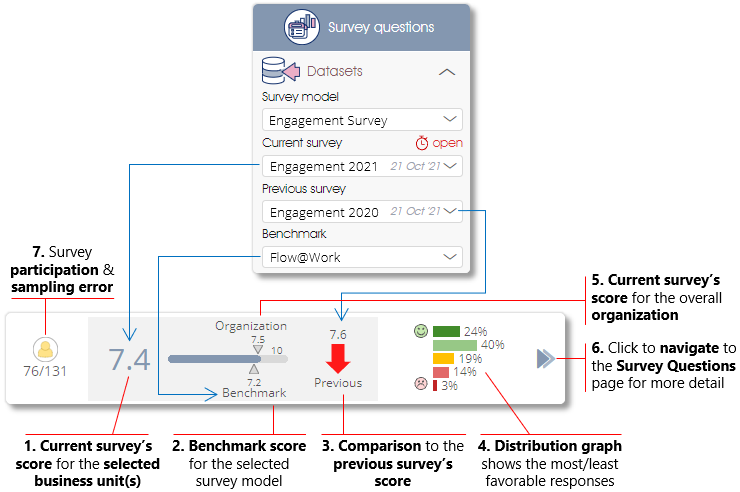
This section reports on the aspects in the work environment that have a direct impact on the levels of engagement or inclusion in the organization. The driver scores are shown as illustrated below:
| 1. |
Current survey’s score for the selected business unit(s) – displays the construct/topic or survey question’s score for the survey campaign (dataset) that was selected as the Current survey (based on the active demographic filter). See Calculating Survey Scores for more on how the scores are calculated. |
| 2. |
Benchmark score – displays the benchmark score (if available) for the construct/topic or survey question. |
| 3. |
Comparison to the previous survey’s score for the selected business unit(s) – shows how much the Current survey score for the construct/topic or survey question differs from the score of the Previous survey campaign or dataset (based on the active demographic filter). A green arrow means the Current survey score went up (is higher) than the Previous survey score. A red arrow means the Current survey score came down (is lower) than the Previous survey score. |
| 4. |
Distribution graph – displays the number or percentage of respondents who selected either the most favorable Likert options (green bar) or least favorable Likert options (red bar). See Calculating Survey Scores for more on how the distribution graph’s numbers/percentages are calculated. |
| 5. |
Current survey’s score for the organization – displays the construct/topic or survey question’s score for the survey dataset that was selected as the Current survey campaign for the organization overall (based on the active demographic filter). |
| 6. |
Click to navigate – click on the arrows to navigate to the Survey Question page for more detail regarding the construct/topic or survey question. |
| 7. |
Survey participation & sampling error – number of respondents (survey sample size) and total employees (survey population) per business unit, as well as an indicator of the sampling error for the business unit. Hover the mouse over the sampling error icon to open a popup with a short explanation (see Sampling Size & Errors for more on this). |
The engagement or inclusion driver scores are shown per construct and top-level business units:
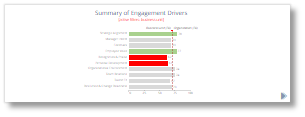 |
Summary of Driver Scores
Bar graph with a summary of the engagement or inclusion driver scores, with the 2 top-scoring drivers highlighted in green, and the 2 bottom-scoring drivers highlighted in red.
- Click on the arrow at the bottom/right of the panel to navigate to the driver construct section of the Survey Questions page.
- See Calculating Survey Scores for more on how the scores are calculate.
|
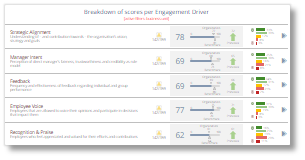 |
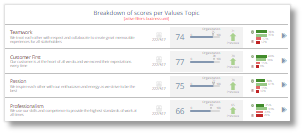
Breakdown of Scores per Driver
Detailed scores per engagement or inclusion driver, including the scores for the Current and Previous surveys (where applicable), distribution graphs and sampling errors.
- Click on the arrows at the right of the distribution graphs to navigate to the driver’s section of the Survey Questions page.
|
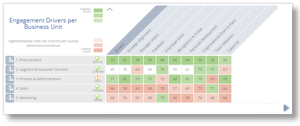 |
Heatmap of Driver Scores per Business Unit
Comparative heatmap that shows the engagement or inclusion driver scores per high-level business unit.
- Click on the arrow at the bottom/right of the panel to navigate to the Heatmap page for more detail.
- Click on the arrows next to the business unit names (where shown) to expand the business unit.
- See Comparative Heatmaps for more on how to expand the business units or set a survey question or demographic filter for the heatmap.
|
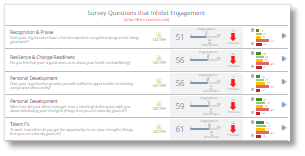 |
Driver Survey Questions with the Highest/Lowest Scores
Summary of the 5 survey questions with the highest scores, as well as the 5 survey questions with the lowest scores.
- Click on the arrows at the right of the distribution graphs to navigate to the Survey Questions page for more detail.
|
|
Drivers Scores per Demographic
The survey scores of Driver survey questions will be summarized via bar graphs for each of the demographic categories (e.g. Gender, Age Group) as defined in the Manage PARTICIPANTS module. Each demographic category’s scores will be calculated and displayed per demographic attribute (e.g. Male, Female in the case of the Gender category).
- See Edit Demographic Data for more regarding the use of demographics in surveys.
- Survey scores of demographic attributes with insufficient responses (fewer than the anonymity threshold) will not be displayed (see Sampling Size & Errors for more on this).
|
Custom Survey Results
Custom surveys, such as a Values or Culture survey, will not have engagement indicator or driver sections, but will instead have a section where the survey’s scores are grouped and displayed according to the survey topics (constructs).
 |
Summary of Scores per Survey Topic
Bar graph with a summary of the survey topic scores, with the 2 top-scoring topics highlighted in green, and the bottom-scoring topics highlighted in red.
- Click on the arrow at the bottom/right of the panel to navigate to the survey topic section of the Survey Questions page.
- See Calculating Survey Scores for more on how the scores are calculate.
|
 |
Breakdown of Topic Scores
Detailed scores per survey topic, including the scores for the Current and Previous surveys (where applicable), distribution graphs and sampling errors.
- Click on the arrows at the right of the distribution graphs to navigate to the appropriate section of the Survey Questions page.
|
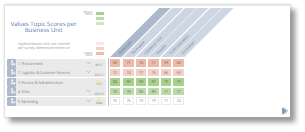 |
Heatmap of Topic Scores per Business Unit
Comparative heatmap that shows the survey topic scores per high-level business unit.
- Click on the arrow at the bottom/right of the panel to navigate to the Heatmap page for more detail.
- Click on the arrows next to the business unit names (where shown) to expand the business unit.
- See Comparative Heatmaps for more on how to expand the business units or set a survey question or demographic filter for the heatmap.
|
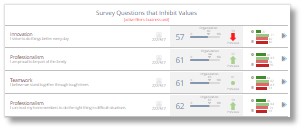 |
Top/bottom Scoring Survey Questions
Summary of the 5 survey questions with the highest scores, as well as the 5 survey questions with the lowest scores.
- Click on the arrows at the right of the distribution graphs to navigate to the Survey Questions page for more detail.
|
|
Topic Scores per Demographic
The survey scores of all survey questions will be summarized via bar graphs for each of the demographic categories (e.g. Gender, Age Group) as defined in the Manage PARTICIPANTS module. Each demographic category’s scores will be calculated and displayed per demographic attribute (e.g. Male, Female in the case of the Gender category).
- See Edit Demographic Data for more regarding the use of demographics in surveys.
- Survey scores of demographic attributes with insufficient responses (fewer than the anonymity threshold) will not be displayed (see Sampling Size & Errors for more on this).
|
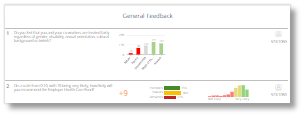
Non-quantified Survey Results & General Feedback
The survey results of non-quantified survey constructs (i.e. survey constructs with the non-quantified option activated) will be grouped into a separate panel. Open-ended survey responses can be viewed on the Survey Questions page or via the Text Analytics tab.
 |
Non-quantified Survey Constructs
Shows the survey scores for all the survey questions included in a non-quantified construct.
- See Constructs & Questions for more regarding non-quantified survey constructs.
- The results of Multiple-choice survey questions will only be displayed as part of a non-quantified construct (see Multiple-choice for more on multiple-choice survey questions).
- The results of Net Promoter Score (NPS) survey questions will also only be displayed as part of a non-quantified construct (see NPS Question for more on NPS questions).
|
Survey Participation
Both the @Way-of-Work surveys as well as any custom survey will have a section where the survey participation rates are summarized.
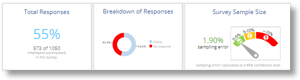 |
Survey Participation Data
The number of survey respondents (survey sample size), a breakdown of the different response types, and the sampling error will be shown (see Sampling Size & Errors for more).
- A sampling error of 5% or less means that the survey results are adequately representative.
- Survey results with a larger sampling error may not be adequately representative of the group being surveyed and should be interpreted (and used) with caution.
|
| For more information, click on a sub-menu item at the top of the page⇑ or in the right margin⇒ |
