
The Comparisons page will allow you to compare different subsets or permutations of quantified survey data by means of up to 4 side-by-side columns. Please note that side-by-side comparisons can only be done on quantified constructs (please click here for more on quantified constructs).

Calculating Survey Scores & Sampling Errors
The survey scores of all multiple choice (Likert) and dropdown survey questions are shown as a score out of 10, regardless of how many Likert options the survey questions had – see Calculating Survey Scores for a more detailed explanation. As an indication of whether the number of survey responses is sufficiently representative of the group being surveyed, a context sensitive sampling error icon will also be displayed where appropriate – see Sampling Size & Errors for a more detailed explanation.
Selecting a Survey Model
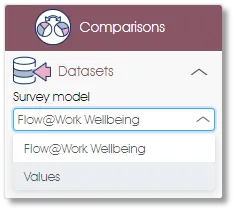
Select the survey model that will be used as the basis for the comparisons between the different columns by clicking on the Datasets | Survey model dropdown in the side panel.
Setting a Filter for a Column
A different survey dataset (campaign) can be selected for each column (see Survey Models/Datasets for more on selecting a survey dataset/campaign), and filters can be set for the units and sub-units as well as for any permutation of demographic data (see Filtering Survey Responses on setting demographic and other filters). User-defined headings can also be entered for each column.
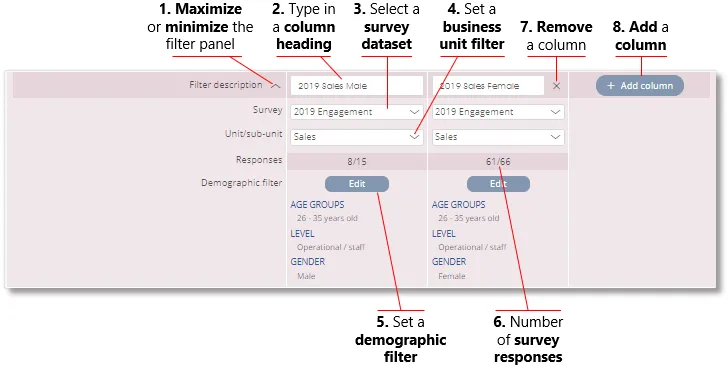
| 1. | Maximize/minimize the filter panel – click on the arrow to minimize the filter panel for a more concise view of the comparative results, and click on it again to open the filter panel for editing purposes. |
| 2. | Column heading – type in a short description of the column that will be displayed for context if the filter panel has been minimized. |
| 3. | Survey dataset – select a survey dataset for the column that should be used for comparison purposes (see Survey Models/Datasets for more on selecting a survey model and dataset). Please note that comparisons can only be made between datasets of the same survey model, e.g. to compare the Q2 Engagement Survey results to the Q1 Engagement Survey results. To select a different survey model, click on the Survey Model option in the side panel. |
| 4. | Business unit filter – select one or more business units to be included in the column (see Filtering Survey Responses on setting a business unit and other filters). |
| 5. | Demographic filter – select the demographic attributes to be included in the column (see Filtering Survey Responses on setting a demographic and other filters). |
| 6. | Number of survey responses – the number of survey responses based on the active business unit and demographic filters will be displayed. |
| 7. | Remove a column – reset the filters and close the current column. |
| 8. | Add a column – add a column and open the filter dialogue. |
| For more information, click on a sub-menu item at the top of the page⇑ or in the right margin⇒ |