
Employee surveys are usually conducted on a voluntary basis. This means a number of employees may elect not to participate in the survey, which could jeopardize the validity of the survey results. To illustrate, if only 5 out of a total population of 10 employees (i.e. 50%) participated in a survey, the survey results of the 5 respondents could hardly be described as a true and fair reflection of the opinions of all 10 employees.
However, from a statistical point of view the survey results would be sufficiently representative if a sample of 500 out of a population of 1,000 employees (also 50%) were to participate in a survey. It is therefore important that as many employees as possible be motivated to participate in the survey, particularly in the case of smaller teams and business units.
Calculating Sampling Errors
To determine whether the number of survey responses from a survey group or business unit are sufficiently representative, it will be necessary to calculate the sampling error, i.e. the extent or margin of error to which a particular sample actually represents the views and opinions of the group being surveyed. From a psychological research perspective, a confidence level of 95% and sampling error of 5% are deemed acceptable. To use the previous example again, a 50% survey response rate for a survey with a total population of 1,000 employees will result in a sampling error of only 3.1%, so the responses will be deemed representative of the population 95% of the time, with a ±5% margin of error (i.e. 45% - 55%).
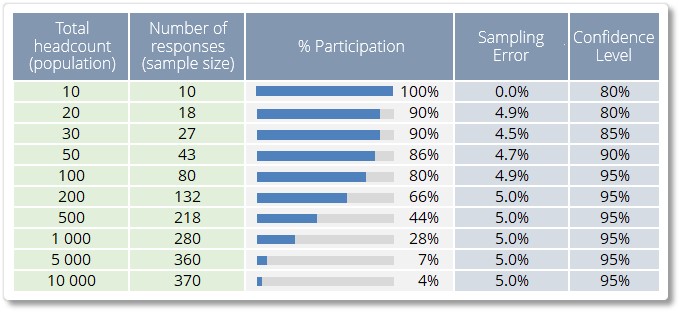
A sampling error of 5% or less means that the survey results are adequately representative, while survey results with a larger sampling error (e.g. 10% or 20%) may not be adequately representative of the group being surveyed and should be interpreted (and used) with caution. The table above illustrates what the minimum sample sizes should be for survey groups of different sizes for a sampling error that is below the 5% threshold.
Please note that in the example above the standard error is scaled to a confidence interval which is more appropriate for smaller population groups. For groups larger than 100, sampling errors are calculated at the customary 95% confidence interval, but for smaller groups the confidence level is gradually reduced – and indicated as such in the dashboard – to 80%.
![]()
More Lenient Rule-of-thumb Sampling Error Calculation
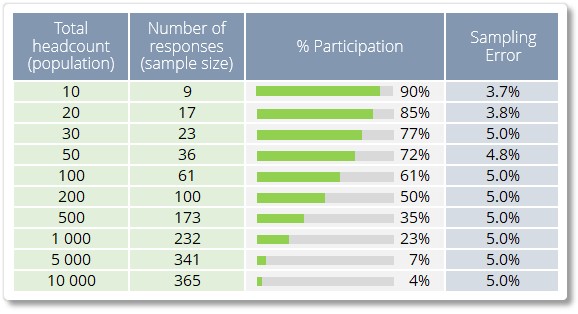
The analytics dashboard makes as an option a more lenient alternative approach to calculating sampling errors available that may be more convenient when surveying smaller survey groups. This method produces an estimate of variability based on the likely conditions of the sample, and does not scale based on other factors related to the sample, and as such, serves largely as a rule of thumb for evaluating the expected variability of the sample at a 95% confidence level. The table below illustrates what the minimum sample sizes should be for survey groups of different sizes using the more lenient rule-of-thump sampling error calculation method.
Showing Sampling Errors in the Dashboard
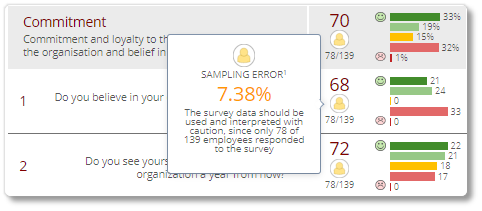
As a guide and to streamline decision-making, the sampling errors of the current permutation of filtered survey data for all survey questions are shown in the dashboard by means of green, orange and red sampling error icons. Just hover with your mouse over the colored icon for more information about the question’s sampling error.
Anonymity Threshold and Confidentially
Please note that to protect the anonymity of survey respondents, the analytics dashboard will not display the survey results of business units and sub-units with fewer responses than the anonymity threshold of minimum 4 survey responses. The anonymity threshold will apply to cases where a business unit and/or demographic filter have been set, and will impact all graphs and tables where survey scores are displayed, such as the Engagement Indicator scores for the Age demographic category on the Summary page.
| For more information, click on a sub-menu item at the top of the page⇑ or in the right margin⇒ |