
The Heatmap function will provide you with a color-coded graphical representation of the survey construct/topic scores per business unit.

Calculating Survey Scores & Sampling Errors
The survey scores of all multiple choice (Likert) and dropdown survey questions are shown as a score out of 10, regardless of how many Likert options the survey questions had – see Calculating Survey Scores for a more detailed explanation. As an indication of whether the number of survey responses are sufficiently representative of the group being surveyed, a context sensitive sampling error icon will also be displayed where appropriate – see Sampling Size & Errors for a more detailed explanation.
Selecting & Filtering Survey Results
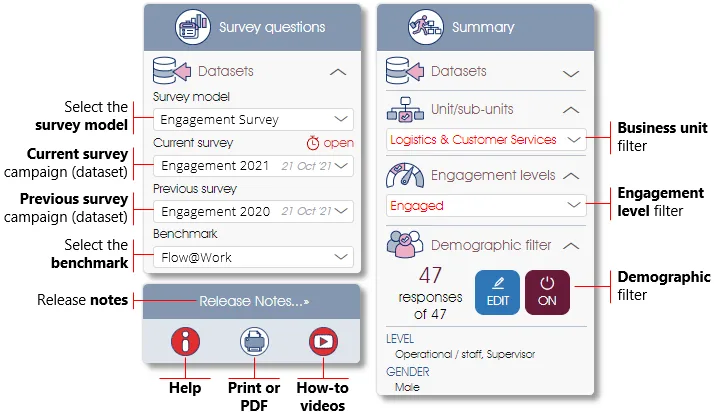
The survey results on this page will be displayed according to the (1) survey model and campaign as selected in the Datasets toolbox in the side panel (see Survey Models/Datasets for more), and the (2) current active filter that has been set for business units, demographics and/or engagement level (see Filtering Survey Responses for more). Click on the How-to icon to view video of the analytics dashboard.
Understanding the Heatmap
The Heatmap is in essence a matrix or table with the survey constructs/topics as column headings, and the business unit or sub-unit survey results as rows.
Dynamic Updating of Business Unit Scores
Business unit scores are dynamic and will be updated based on the business unit filter that has been set. To illustrate using the heatmap image below: the survey scores of the 2.2 Deliveries business unit are (as shown) the combined average scores of the 2.2.1 Automated Deliveries, 2.2.2 Postal Deliveries, 2.2.3 Truck Deliveries and 2.2.4 Self-service Deliveries sub-units. However, the 2.2 Deliveries business unit's scores will be updated if a business unit filter is set that will result in for instance the 2.2.4 Self-service Deliveries sub-unit not being shown.
Color-coding of Top/bottom Scoring Business Units
The survey scores of the three business units that achieved the highest or top scores for a survey construct/topic will be color-coded in different shades of green, and the survey scores of the business units with the lowest or bottom scores in shades of pink/burgundy. For comparison and color-coding purposes, the expanded/lowest level business unit/sub-units will always be used and/or color-coded where appropriate; the scores of higher-level business units (e.g. 2.2 Deliveries) will not be color-coded and will instead be shown in a neutral grey.
Note: in case of the Engaged@Way-of-Work engagement survey, the top/bottom color-coding for the Not Engaged and Disengaged engagement levels will be reversed, since these two engagement levels are negative (not good). The positive (good) engagement levels, i.e. Engaged and Fully Engaged, will be shown with the normal top/bottom color coding.
Interacting with the Heatmap
The different Heatmap options and controls are explained in more detail below. Due to the dynamic nature and potential size of Heatmaps, it will not be possible to generate a PDF of the Heatmap. However, Heatmaps that are part of the Summary page will be included in PDF's that are generated of the Summary page, but will be truncated to fit into the page. Please note that the Heatmap shown below comes from the Engaged@Way-of-Work engagement survey, which is why it shows the engagement levels per business unit.
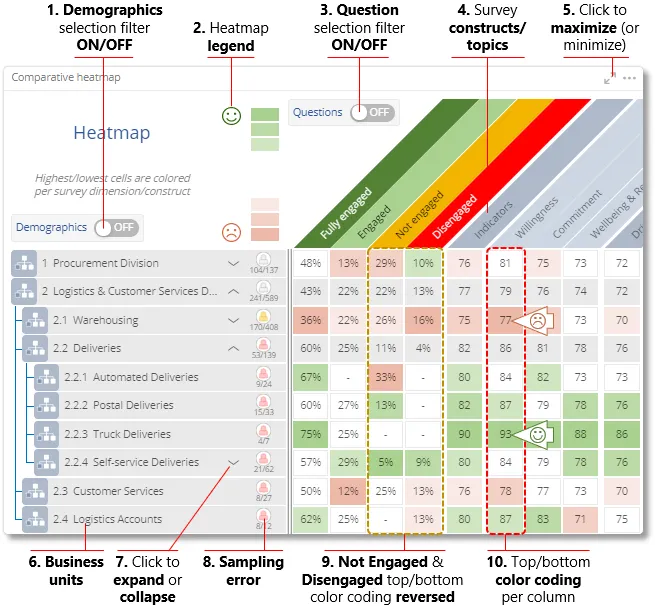
| 1. | Demographic selection ON/OFF – select the ON option to display the survey scores for specific demographic attributes (e.g. age group, gender) for each of the survey constructs/topics and/or survey questions as selected (see point 3 below). |
| 2. | Heatmap legend – illustrates the color-coding used to highlight the bottom/low and top/high scores per survey construct/topic. |
| 3. | Question selection ON/OFF – select the ON option to selectively display the survey scores for specific survey constructs/topics and/or survey questions. |
| 4. | Survey constructs/topics – displays either a default list of the indicators and driver constructs (Engaged@Way-of-Work or Inclusion@Way-of-Work surveys) or survey topics (custom surveys), or a selected list (see point 3 above). |
| 5. | Maximize (or minimize) the heatmap – click on the arrows to maximize the heatmap so it fills the entire browser screen, and click again to minimize it to its default size. |
| 6. | Business units – hierarchy of business units as defined or captured by means of the Manage Participants function. |
| 7. | Expand or collapse a business unit – click on the arrow next to a business unit name to expand or collapse the sub-units. |
| 8. | Sampling error – number of respondents (survey sample size) and total employees (survey population) per business unit, as well as an indicator of the sampling error for the business unit. Hover the mouse over the sampling error icon to open a popup with a short explanation (see Sampling Size & Errors for more on this). |
| 9. | Not Engaged/Disengaged Reversed – in case of the Engaged@Way-of-Work engagement survey, the top/bottom color-coding for the Not Engaged and Disengaged engagement levels will be reversed, since these two engagement levels are negative (not good). |
| 10. | Color-coding per column – demonstrate how the color-coding is applied vertically, per survey construct/topic column. |
Displaying the Survey Scores for one or more Survey Questions
The Heatmap will by default display the business unit scores per construct/topic, with the constructs/topics as the column headings. You can, however, restructure the columns by selecting one or more survey questions for display purposes; the survey scores of the selected survey questions will then be shown per business unit, with color-coding to highlight the top and bottom scores per business unit.
To select one or more survey questions for display purposes, set the Questions switch to ON and click on the Select button that will be displayed – the Select columns dialogue window where you can select the survey questions that should be used, will be opened. Please note that the Heatmap shown below comes from the Engaged@Way-of-Work engagement survey, which is why it shows the engagement levels per business unit.
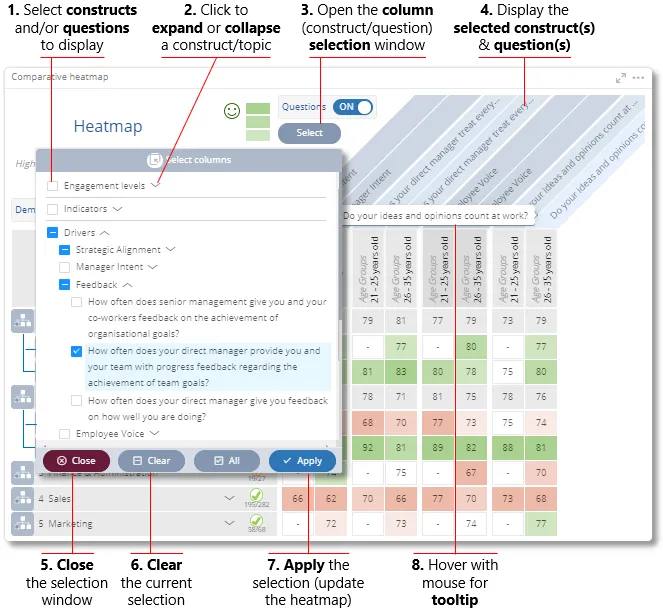
| 1. | Select constructs and/or survey questions – click on the check boxes to select a survey construct/topic or survey question for inclusion in the Heatmap columns. |
| 2. | Expand/collapse survey constructs/topics – click on the arrow to expand a construct/topic (i.e. display the options and/or survey questions), and click again to collapse. |
| 3. | Open column selection window – click on the Select button to open the Select columns window. |
| 4. | Display selected construct/topic(s) & question – the survey construct/topic(s) and/or survey questions as selected will be shown as column headings. |
| 5. | Close – click on the Close button to close the window. |
| 6. | Clear – click on the Clear button to deselect all the survey construct/topic(s) and/or survey questions that are currently selected. |
| 7. | Apply – click on the Apply button to apply the selection and to update the Heatmap. |
| 8. | Hover with mouse for tooltip – hover with the mouse over a survey questions for a tooltip that shows the entire question. |
Displaying the Survey Scores for selected Demographic Attribute(s)
Survey scores can also be shown per demographic attribute, e.g. for certain age groups or genders. To select one or more demographic attributes for inclusion in the Heatmap, set the Demographics switch to ON, and then click on the Select demographics button that will be displayed – the Select demographics dialogue window where you can select the demographic attributes that should be used, will be opened.
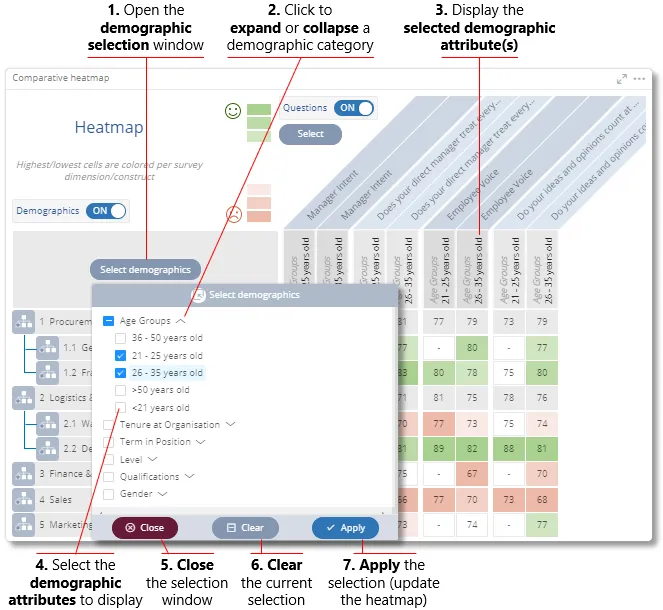
| 1. | Open demographic selection window – click on the Select demographics button to open the Select demographics window. |
| 2. | Expand/collapse survey constructs/topics – click on the arrow to expand a demographic category (i.e. display the demographic attributes), and click again to collapse. |
| 3. | Display selected demographic attributes – the survey scores for the survey question as selected will be displayed for each of the demographic attributes that have been selected. |
| 4. | Select demographic attributes – click on the check boxes to select a demographic attribute for inclusion in the Heatmap columns. |
| 5. | Close – click on the Close button to close the window. |
| 6. | Clear – click on the Clear button to deselect all the survey construct/topic(s) and/or survey questions that are currently selected. |
| 7. | Apply – click on the Apply button to apply the selection and to update the Heatmap. |
| For more information, click on a sub-menu item at the top of the page⇑ or in the right margin⇒ |