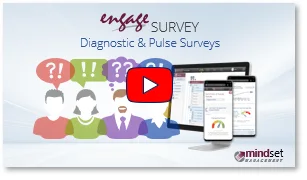
The Engage ANALYTICS dashboard is a powerful, interactive analytics tool that will provide you with the insights necessary to drive culture, engagement and retention at all levels of your organization. The dashboard will allow you to:
- View and track survey participation and responses in real-time;
- Segment, sort and analyze your survey data to get down to the real issues that matter;
- Filter and compare survey responses for any demographic, department, region or team in your organization;
- Drill down to review or interpret survey responses on an individual survey question level;
- Compare survey results to previous surveys or to benchmark data; and
- Create custom PDF reports of any segmentation of survey data.
Product Modules
The Engage ANALYTICS dashboard has 7 main modules or menu items:
| 1 | Summary of Survey Results |  ⇒ ⇒ |
Aggregate survey results at organizational as well as business unit level, including top/bottom scoring survey questions and results per demography. |
| 2 | Visualizing data with a Heatmap |  ⇒ ⇒ |
View and compare the survey results of regions, departments and teams (business units) |
| 3 | Survey Model & Questions |  ⇒ ⇒ |
Birds-eye view of the survey model – drill down to explore the survey results of individual survey questions, grouped per survey dimension or construct. |
| 4 | Text Analytics |  ⇒ ⇒ |
View, sort and search open-ended qualitative responses and comments according to topics (themes), sentiments or keywords. |
| 5 | Comparisons of Survey Results |  ⇒ ⇒ |
Compare the survey results – per survey dimension or construct and question – of any demographic permutation and/or region, department and team. |
| 6 | Survey Participation Data |  ⇒ ⇒ |
View the survey participation rates and demographic breakdown for the organization overall as well as for the different regions, departments and teams. |
| 7 | Pulses & Trend Graphs |  ⇒ ⇒ |
View trend graphs of diagnostic and pulse survey results as well as the detailed pulse survey results and participation data of one or more pulse surveys. |
Related Engage How-to Videos
 |
| (5.28 minutes) Working with Virtual Structures The innovative approach to structuring and keeping your employee data up to date in preparation for an employee survey |
| For more information, click on a sub-menu item at the top of the page⇑ or in the right margin⇒ |

