
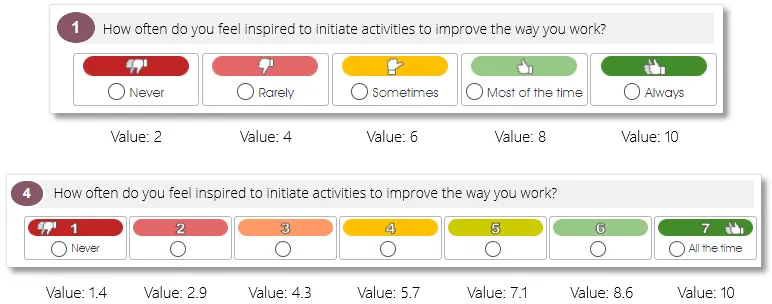
Likert (multichoice) survey question scores are shown as a score out of 10, and are calculated as a function of the number of respondents for each of the question’s Likert options. The calculation works like this: the number of Likert options that a survey question have will determine the value of each Likert option. For example, the Likert options of a 5-Likert survey question will each have a value of 2, so selecting the Disagree Strongly option will result in a score of 2 for the question, while the Agree Strongly option will result in a top score of 10. The Likert options of a 7-Likert survey question will instead have a value of 1.43 each, but will also have a score of 10 for the top option.
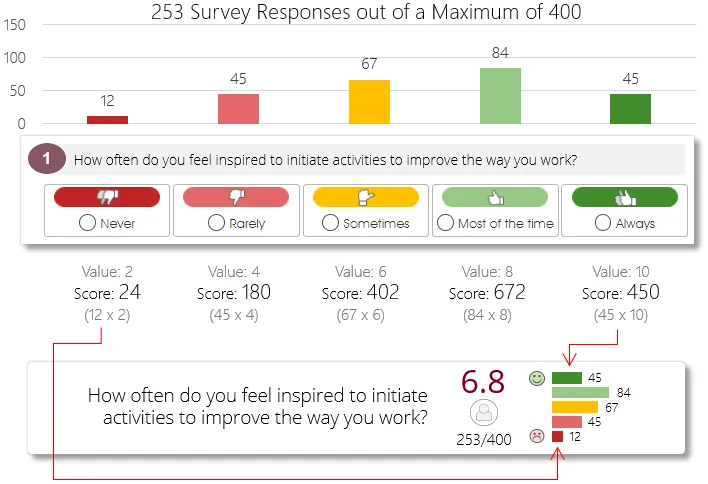
The number of survey responses for each Likert option will then be multiplied by the Likert option’s value and summated to get a total score for the question, which is then recalculated so the final score can be shown out of a total of 10.
In the example below, a survey question with 5 Likert options received a total of 200 survey responses (survey sample size) out of a total of 400 potential respondents (survey population), with 100 respondents choosing the Never option (value = 2) and 100 respondents choosing the Always option (value = 10). The number of responses for each Likert option are then multiplied with the Likert option’s value, and summated to get the final score – in this case, a final score of 1 200 out of a potential maximum score of 2 000 (the total of 200 respondents multiplied by the maximum Likert value of 10). The score is then adjusted and rounded off and shown as a value out of 10 in the analytics dashboard.
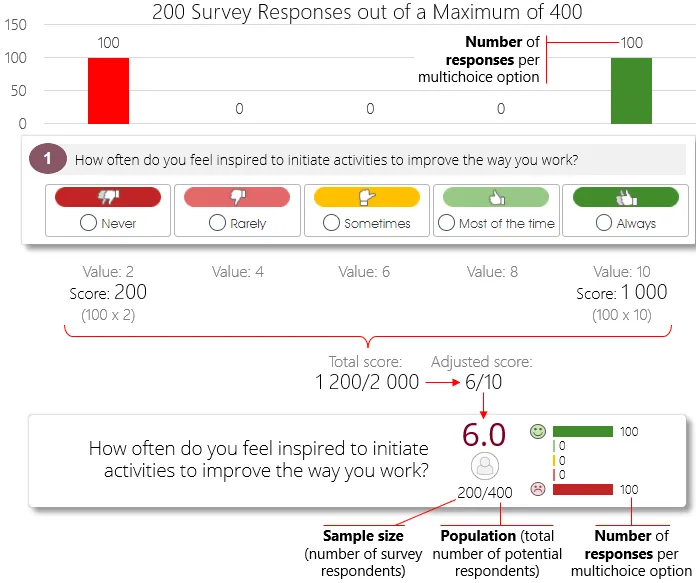
The distribution of the survey responses (i.e. number of respondents who selected the different Likert options) will be shown via a 5-bar graph in case of a 5-Likert survey question, as shown below, and will be averaged and shown as a percentage per Likert option in case of a construct.
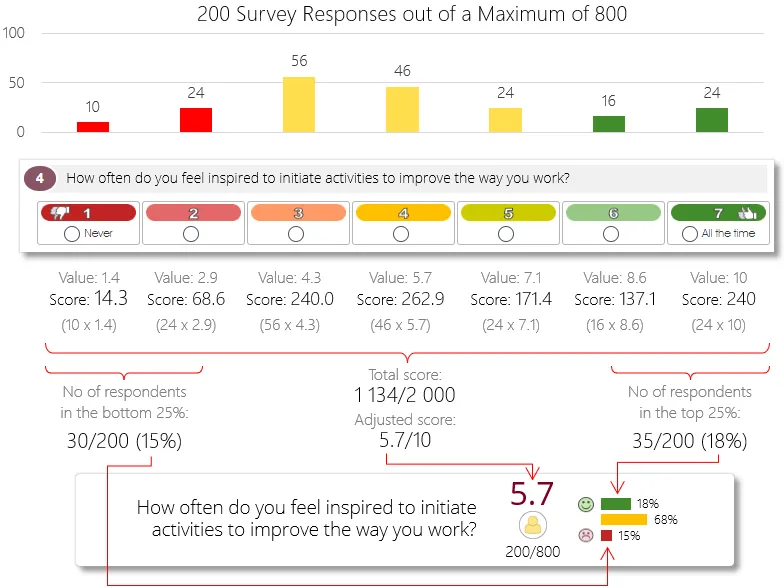
Please note that the distribution of survey responses will only be shown per individual Likert option for survey questions with a maximum of 5 Likert options. The distribution of survey responses will instead be shown via a 3-bar graph in case of Likert questions with more than 5 Likert options: the red bar will show the number of respondents who selected the bottom 25% most negative options, and the green bar the number who selected the top 25% most positive Likert options.
Below is another example, this time with a survey question with 7 Likert options, also with a random distribution of the 200 survey responses. The number of respondents for each Likert option is again multiplied with the Likert option’s value, and summated to get the final score of 1 134 out of a potential maximum score of 2 000 (200 respondents multiplied by the maximum Likert value of 10), which is then adjusted and rounded off and shown as a value out of 10. The distribution graph, however, shows the number of respondents who selected the bottom (most negative) 25% of the Likert options as a red bar, and the number of respondents who selected the top (most positive) 25% of the Likert options as a green bar.
| For more information, click on a sub-menu item at the top of the page⇑ or in the right margin⇒ |