
Mindset's @Way-of-Work range of engagement, inclusion and wellbeing survey model templates use different surveys questions (grouped into constructs or related topics/themes) to separately measure the Indicators and Drivers of engagement and diversity/inclusion respectively: the Indicators measure the level or state (outcomes) of engagement and diversity/inclusion, while Drivers measure the contributing factors that have a direct impact on engagement and diversity/inclusion - see Engaged@Way-of-Work Model or Inclusion@Way-of-Work Model for more.
For better context and maximum visual impact, the survey results of the Indicator survey constructs and questions are displayed via separate, dedicated Indicator panels in the analytics dashboard - as illustrated below. To make any of these Indicator panels part of your own custom engagement or diversity/inclusion survey, you just have to include the relevant Indicator constructs and their unique construct codes in your survey.
Engaged@Way-of-Work Engagement Indicator Constructs
The Engaged@Way-of-Work engagement survey model uses the following two mandatory Indicator constructs:
| Construct | Construct Code | Description |
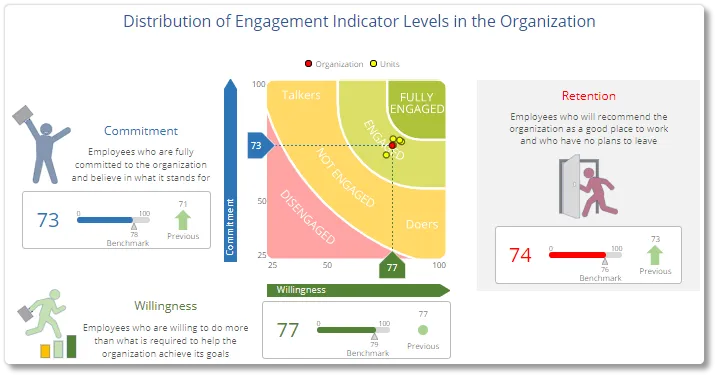
| Willingness | K4HsnmnUR1y5xb7q4ClfYQ | Willingness to invest additional (discretionary) effort to help the organisation achieve its goals |
| Commitment | PO2uzkbDQUK4WpNQBvHowg | Commitment and loyalty to the job and the organisation and belief in what it stands for |
The survey scores for the Willingness and Commitment Indicator constructs will be averaged and used as the basis to calculate the engagement levels at organization and business unit level, and will be mapped by means of a scatter graph as shown below.
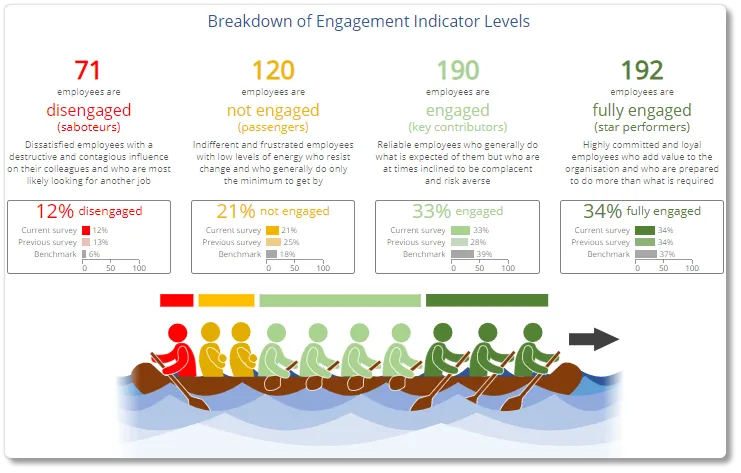
The number and percentage of employees at each of the different engagement levels will be shown in the analytics dashboard as illustrated below - at organizational level by default, or for one or more business units if a business unit filter has been set:
The Engagement Indicator scores will also be shown by means of a comparative Heatmap at business unit level, as well as per user-defined Demographic category (e.g. Gender, Age group).
Inclusion@Way-of-Work Diversity & Inclusion Indicator Constructs
The Inclusion@Way-of-Work Diversity & Inclusion survey model uses the following two mandatory Indicator constructs:
| Construct | Construct Code | Description |
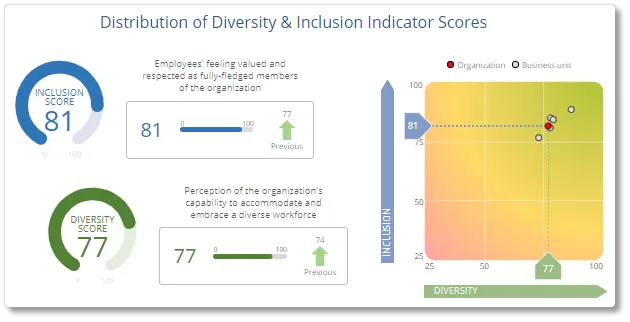
| Inclusion | a6A5ITFxQJOArQk1-qndeA | Employees' feeling valued and respected as fully-fledged members of the organization |
| Diversity | 7TLgHA-uRoiU3u02nMo_mQ | Perception of the organization's capability to accommodate and embrace a diverse workforce |
The survey scores for the Inclusion and Diversity Indicator constructs will be averaged and mapped by means of a scatter graph as shown below.
The Inclusion and Diversity Indicator scores will also be shown by means of a comparative Heatmap at business unit level, as well as per user-defined Demographic category (e.g. Gender, Age group).
| For more information, click on a sub-menu item at the top of the page⇑ or in the right margin⇒ |