
The Pulses & Trends page will provide you with trend graphs and survey scores of one or more pulse surveys that were conducted.

Calculating Survey Scores & Sampling Errors
The survey scores of all multiple choice (Likert) and dropdown survey questions are shown as a score out of 10, regardless of how many Likert options the survey questions had – see Calculating Survey Scores for a more detailed explanation. As an indication of whether the number of survey responses is sufficiently representative of the group being surveyed, a context sensitive sampling error icon will also be displayed where appropriate – see Sampling Size & Errors for a more detailed explanation.
Selecting & Filtering Survey Results
The survey results on this page will be displayed according to the (1) survey model and pulse survey questionnaire as selected in the Datasets toolbox in the side panel (see Survey Models/Datasets for more), and the (2) current active filter that has been set for business units, demographics and/or engagement level (see Filtering Survey Responses for more). Selecting the Pulse questionnaire and Date range will be discussed in more detail in the following sections.
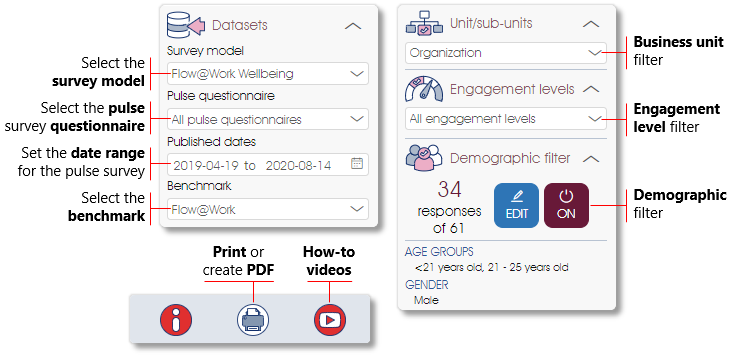
Click on the Print/PDF icon to print or generate a PDF report of the current content as displayed, and on the How-to icon to view How-to videos of the analytics dashboard.
Displaying Survey Trends
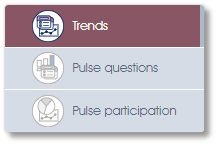
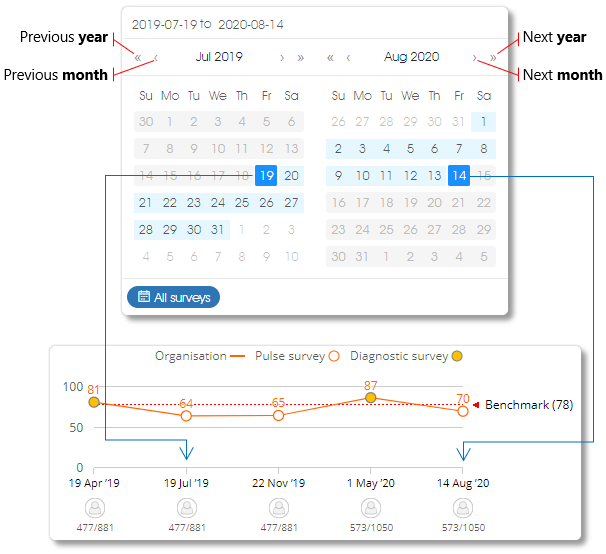
The Trends toolbox item in the side panel will allow you to view trend graphs of selected and/or filtered diagnostic and pulse survey results. The trend graphs will be displayed (according to the active filter) as shown and outlined below:
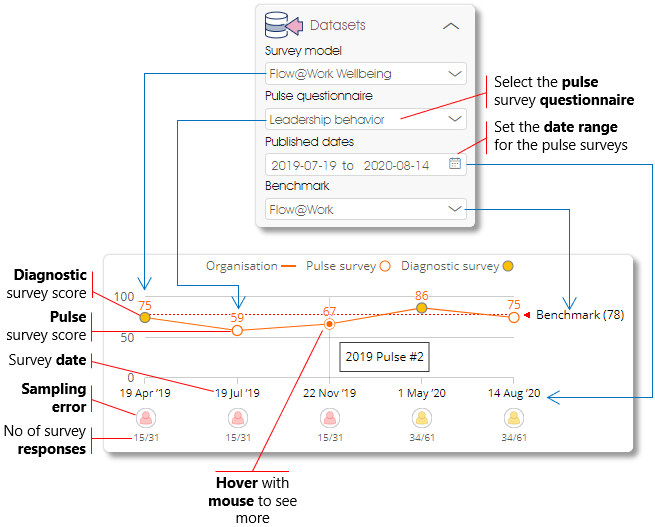
- Diagnostic survey scores – display the survey scores of the diagnostic surveys (if any) that were conducted with the selected survey model as basis.
- Pulse survey scores – pulse survey scores of the selected pulse survey questionnaires that were conducted in the date range as selected (see next point).
- Survey dates – select the start and end dates for the pulse survey results to be displayed, e.g. show all the pulse survey results that were conducted between July 2019 and August 2020.
- Sampling error – displays a colored indicator of the sampling error for the business unit. Hover with the mouse over the sampling error icon to open a popup with a short explanation (see Sampling Size & Errors for more on this).
- Number of survey responses – number of survey responses (sample size) out of the total survey population.
- Hover with mouse – hover with your mouse over a pulse survey score to display the name of the pulse survey.
Selecting a Pulse Survey Questionnaire
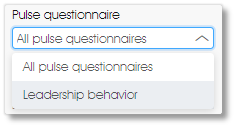
Click on the Pulse questionnaire dropdown to view a list of all the pulse survey questionnaires that have been defined for the selected survey model:
- Select the All pulse questionnaires option to display the survey results of all diagnostic and pulse surveys that were conducted during the date range (see next point).
- Select one of the listed pulse survey questionnaires (e.g. Leadership behavior in the example below) to display only the survey results of all the pulse surveys that were conducted with the selected pulse survey questionnaire during the date range (see next point).
Setting a Date Range for the Pulse Surveys
Click on the Published dates dropdown to access a dual-calendar display that will allow you to select the start and end dates for the pulse survey results to be displayed. The start and end dates will be highlighted in dark blue, and the selected dates in light blue:
- Click on the arrows at the top of the calendar to navigate to an earlier or later date.
- Select the start date by clicking on a date in the calendar on the left, and an end date by clicking on a date in the calendar on the right; the system will automatically select all pulse surveys that were conducted between these two dates.
- Click on the All surveys button to automatically select all available surveys for the selected pulse survey questionnaire.
Viewing Pulse Question Scores
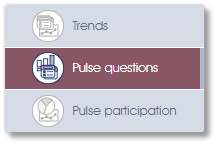
The Pulse questions toolbox item in the side panel will allow you to view the survey scores of the survey constructs and questions of the selected pulse survey(s). The survey results will be displayed (according to the active filter) as outlined below:
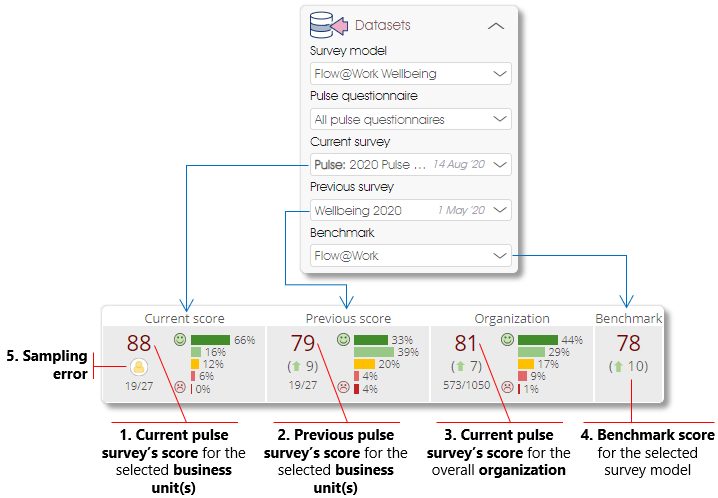
| 1. | Current pulse survey’s score for the selected business unit(s) – displays the score of the construct/topic or survey question of the pulse survey that was selected as the Current survey (based on the active demographic filter). See Survey Question Scores for more on how the scores are calculated. The sampling error icon and the number of respondents (survey sample size) and total number of employees (survey population) for the selected business unit(s) and demographic filter will be shown below the survey score. |
| 2. | Previous pulse survey’s score for the selected business unit(s) – displays the score of the construct/topic or survey question of the pulse survey that was selected as the Previous survey (based on the active demographic filter). A green arrow highlights the fact that the Current survey score is higher than the Previous survey score by the number at the right of the arrow (i.e. 9 in the example above), and a red arrow that the Current survey score is lower than the Previous survey score. |
| 3. | Current pulse survey’s score for the organization – same as (1) above, but displays the organization’s overall score for the pulse survey question (based on the active demographic filter). A green or red arrow indicates that the Organization's survey score is higher or lower than the Current survey score of the selected business unit(s) - if any have been selected. |
| 4. | Benchmark score – displays the benchmark score (if available) for the construct/topic or survey question, and a green/red arrow to highlight the difference with the Current survey score of the selected business unit(s) - if any have been selected. |
| 5. | Sampling error – displays a colored indicator of the sampling error for the business unit. Hover with the mouse over the sampling error icon to open a popup with a short explanation (see Sampling Size & Errors for more on this). |
The survey constructs/topics will by default be shown in a collapsed state – click on the arrows next to the construct name or survey question to expand or collapse a survey construct/topic.
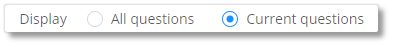
Select the All questions option at the top of the page to view the survey results of all the survey questions that were included as part of the selected survey questionnaires – which will include diagnostic survey results if the All pulse questionnaires option has been selected via the Pulse questionnaire dropdown. The Current questions option will instead display only the survey questions of the pulse survey questionnaires that have been selected as Current and Previous surveys.
Viewing Pulse Survey Participation
The Pulse participation toolbox item in the side panel will provide you with a summary of the pulse survey participation rates for the organization overall and per business unit, as well as a breakdown of the participation rates per demographic category. See Survey Participation Data for more on how the survey participation data is structured.
| For more information, click on a sub-menu item at the top of the page⇑ or in the right margin⇒ |