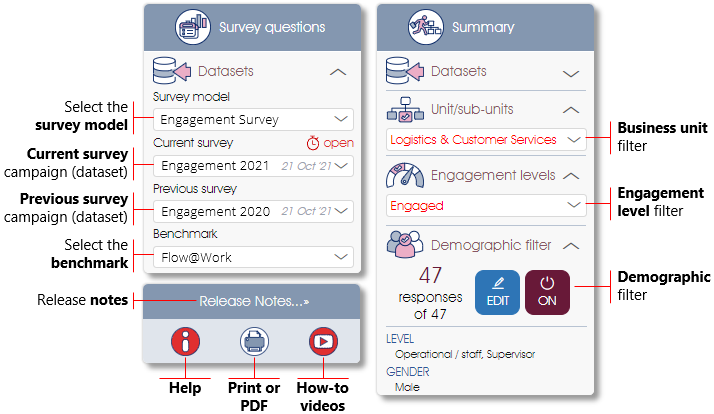
The Participation page will provide you with a summary of the survey participation rates for the organization overall and per business unit, as well as a breakdown of the participation rates per demographic category.

The data on this page will be displayed according to the (1) survey model and campaign as selected in the Datasets toolbox in the side panel (see Survey Models/Datasets for more), and the (2) current active filter that has been set for business units, demographics and/or engagement level (see Filtering Survey Responses for more). Click on the How-to icon to view the video of the analytics dashboard.
 |
Survey Participation Data
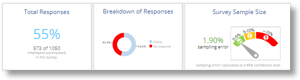
The number of survey respondents (survey sample size), a breakdown of the different response types, and the sampling error will be shown (see Sampling Size & Errors for more).
- Note: a sampling error of 5% or less means that the survey results are adequately representative, while survey results with a larger sampling error (e.g. 10% or 20%) may not be adequately representative of the group being surveyed, in which case the survey results should be interpreted (and used) with caution.
|
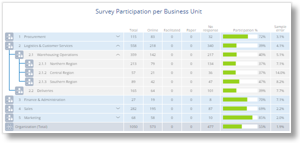 |
Survey Participation per Business Unit
Survey participation rates and sampling errors per business unit. Click on the arrows next to the business unit names to expand or collapse the sub-units.
|
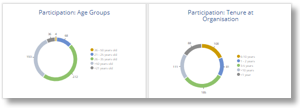 |
Participation per Demographic
Survey participation rates will be summarized via doughnut graphs for each of the demographic categories (e.g. Gender, Age Group) as defined in the Manage PARTICIPANTS module (see Edit Demographic Data for more).
|
| For more information, click on a sub-menu item at the top of the page⇑ or in the right margin⇒ |
