
Most organisations that run engagement surveys, culture assessments, or employee feedback processes collect two types of data. The first is structured and quantitative: Likert scales, ratings, rankings, percentages. This data gets reported, benchmarked, and acted upon. It has a clear home in dashboards and executive presentations. The second type is qualitative: open-ended text responses, written comments, interview transcripts, free-text fields. This data, more often than not, gets skimmed, selectively quoted, or quietly ignored.
This underutilisation happens because qualitative data is difficult to process. It doesn't fit neatly into a spreadsheet. You can't average words. You can't rank opinions and experiences from highest to lowest and put a traffic light next to it. And for a long time, the only way to properly analyse it was to sit down with the raw text, read every single response, code it manually, and try to build a coherent picture from what is, by nature, unstructured and messy. That process worked reasonably well when you had 40 interview transcripts or a couple of hundred open-ended responses. It does not work when you have 10,000.
So what happened in practice was one of two things. Either someone in HR or consulting read through as much as they could, pulled out a handful of illustrative quotes, and presented those alongside the quantitative findings. Or the qualitative data was left in a spreadsheet somewhere and never looked at again. In both cases, the richest, most nuanced data the organisation had collected was effectively wasted.
What has changed
In the last two years, advances in artificial intelligence, and in particular in natural language processing, have fundamentally shifted what is possible with qualitative data analysis. I want to be specific about what I mean here, because "AI" has become one of those terms that gets applied so broadly it risks meaning nothing at all.
What has changed is that we now have tools capable of processing large volumes of unstructured text with a level of analytical sophistication that was previously only achievable through painstaking manual work by trained researchers. I am not talking about feeding a dataset into a chatbot and asking it to "give me the key themes". That produces surface-level output that lacks rigour and, frankly, is not something I would put my name behind or present to a client.
What I am talking about is the ability to apply structured, methodologically sound qualitative research techniques, such as thematic analysis, sentiment analysis, linguistic feature analysis, co-occurrence mapping, and network analysis, at a scale and speed that would have been unthinkable even three years ago. The analytical logic remains grounded in established social science methodology. What has changed is the capacity to apply that logic across thousands or tens of thousands of responses, systematically and consistently.
This means, for example, that you can now map how frequently different themes emerge within a qualitative dataset, how those themes cluster together, and where tensions or contradictions exist between what respondents describe as helping them versus what they describe as getting in the way. You can examine sentiment at a granular level, using validated psycholinguistic frameworks, and compare emotional profiles across different groups, functions, or levels in the organisation. You can even analyse the linguistic features of how people write, and extract meaning from patterns that no human reader could detect at volume.
What this looks like in practice
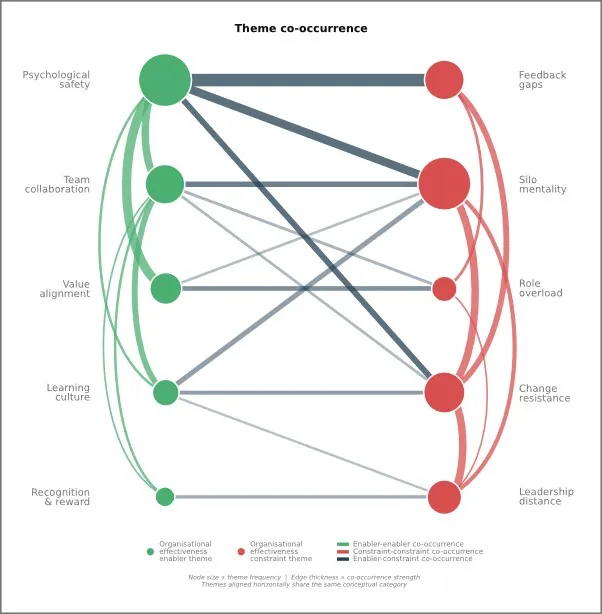
None of this replaces the need for structured, quantitative data. It complements it. The structured survey tells you where to look. It can quickly flag problem areas, and platforms like Mindset's Flow@Work do this very well. A qualitative analysis can tell you in more detail what you are actually looking at. Let me provide some examples. Imagine a pulse survey is sent out to employees, asking them for feedback on what helps or hinders their contribution to organisational effectiveness, and allows them to add open-ended responses to each of the questions. When employees respond with qualitative data, their answers naturally contain multiple themes, and those themes do not appear in isolation. A co-occurrence map, like the one shown below, takes this messy body of text and turns it into something navigable. It shows you three things at once: how prominently each theme featured in the data, how often certain themes cluster within meaningful groups such as enablers and constraints, and how often those groups emerge together. The intersections between enablers and constraints are often the most revealing finding of all, because they point to places where a strength and a barrier are so consistently raised together that they are clearly two sides of the same organisational challenge.
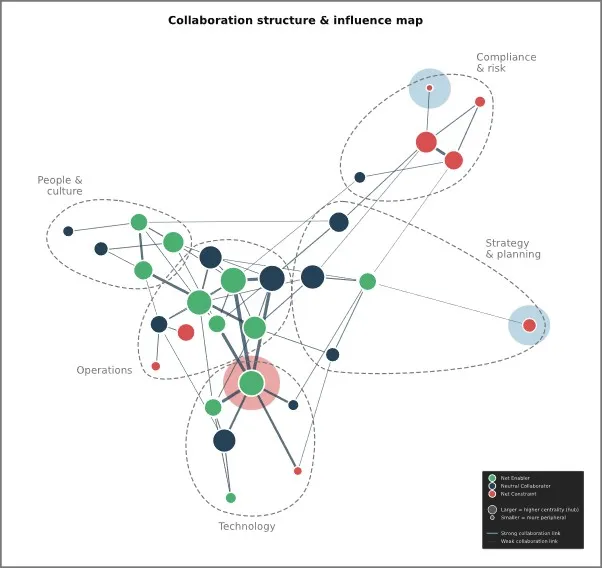
Another good example is organisational network analysis. One is able to build network maps from qualitative text, by identifying which organisational units, functions, or sub-departments are named in connection with specific themes, and mapping how those connections relate to each other. In the example below, sub-departments across five functional areas of an organisation were mapped using qualitative data to identify which clusters were associated with enabling effectiveness and which with constraining it. Two sub-departments, shaded in blue, emerged as functionally isolated from the broader network and a third, shaded in red, turned out to be a strong enabler but one carrying significantly more collaborative weight than is sustainable. That is the kind of finding that changes how you allocate resources, restructure teams, or intervene before a quiet contributor burns out.
These are the kinds of analyses we produce from real organisational data. This is where the real value lies. Not in replacing surveys with text analysis, but in connecting the two so that each source of data makes the other more useful.
The work we are doing at LBVC
At LBVC, we build bespoke qualitative data analytics solutions designed to handle exactly this kind of work. We take qualitative data in whatever form it arrives, open-ended survey responses, interview transcripts, focus group notes, or customer feedback, and apply rigorous, scientifically grounded methodology to surface the patterns, themes, and tensions that matter most. Our outputs go well beyond a list of themes. We examine how themes co-occur, how intensely they are expressed, what the underlying language tells you about how people are experiencing their work or your brand, and where relevant, we integrate the qualitative findings with existing quantitative data so that the two speak to each other.
Our approach is analytically transparent and methodologically defensible. I say this because it matters. Anyone can run text through a language model and produce a summary. What we produce is analysis you can stand behind in a boardroom, in a strategy session, or in front of a regulator, because the methodology is sound, the findings are traceable, and the interpretive framework is grounded in established science.
If your organisation collects qualitative data through engagement surveys, feedback processes, or any other mechanism, and you are not currently doing anything meaningful with it, that data is sitting there waiting to tell you something important. And now, for the first time, there is a practical, scalable way to listen.
Click here for more about LBVC...